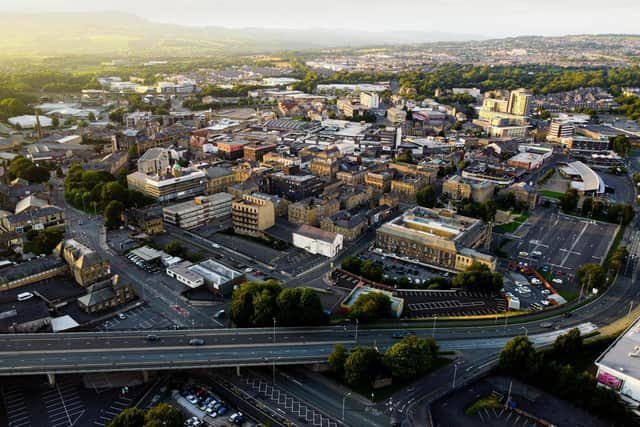
Census 2021: First results show Burnley’s population has grown over past decade
and live on Freeview channel 276
The census takes place every 10 years, with every household in the UK required to take part.


Advertisement
Hide AdAdvertisement
Hide AdNow the first results have been released – and there’s been a sharp rise in the number of people living in Burnley.
On census day, a total of 94,700 people were living in the area – up 9% from 87,059 10 years ago, when the last census was carried out.
This also means the population density has grown to 856 usual residents per square kilometre, up from 787 in 2011.
The census is crucial for the UK’s statisticians to understand how our population is changing, and plays a vital role in how our public services and government operate.
Advertisement
Hide AdAdvertisement
Hide AdIt shows the balance of men and women in the area has changed – Burnley’s population is now 49.4% male and 50.5% female, meaning there is now a higher proportion of men in the area than 10 years ago.
In 2011, people living in Burnley were 49.2% male and 50.8% female.
It also shows the area has seen a rise in the proportion of both young children and the elderly – a decade ago the population was made up of 12.7% under-10s and 16.2% over-65s, but this had changed to 12.7% and 17.7% respectively by 2021.
Across England and Wales, the total population grew 6.3% over the past decade, from 56,075,912 in 2011 to 59,597,300 last year.
Advertisement
Hide AdAdvertisement
Hide AdThis included a 5.2% increase in the North West, where the population rose to 7,417,300 from 7,052,177 in 2011.
There were 24.8 million households in England and Wales on census day 2021, up from 23.4 million in 2011, with an average of 2.4 people in each household – the same as in 2011.
Historic populations of Burnley:
1981: 91,455
1991: 91,130
2001: 89,537
2011: 87,059
2021: 94,700
Historic populations of the North West:
1981: 6,834,647
1991: 6,726,860
2001: 6,729,764
2011: 7,052,177
2021: 7,417,300