
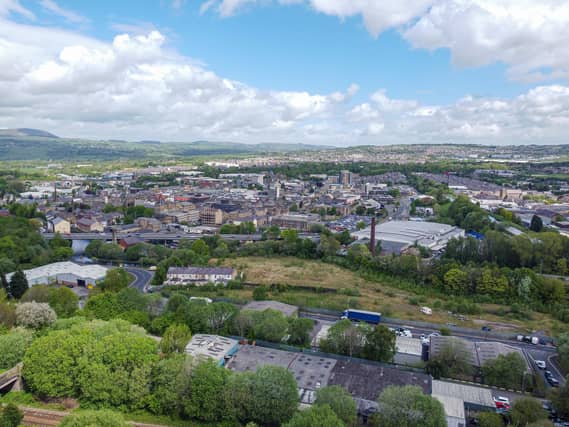

Every area in the borough has seen growth, though some neighbourhoods have risen faster than others.
Data from the Office for National Statistics (ONS) highlights the long-term changes in the local housing market, offering a clear picture of how property values have evolved between March 2005 and March 2025.
(Photos for illustrative purposes only.)
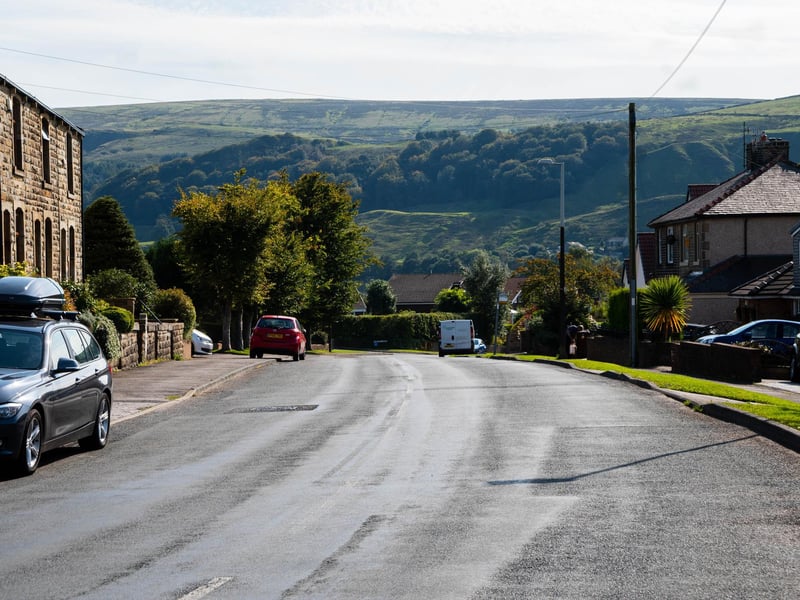
13. Cliviger, Worsthorne and Lane Bottom
Property prices climbed from £126,000 in March 2005 to £237,000 by March 2025. Photo: Kelvin Stuttard
4 / 4