
Every area in the borough has seen growth, though some neighbourhoods have risen faster than others.
Data from the Office for National Statistics (ONS) highlights the long-term changes in the local housing market, offering a clear picture of how property values have evolved between March 2005 and March 2025.
(Photos for illustrative purposes only.)
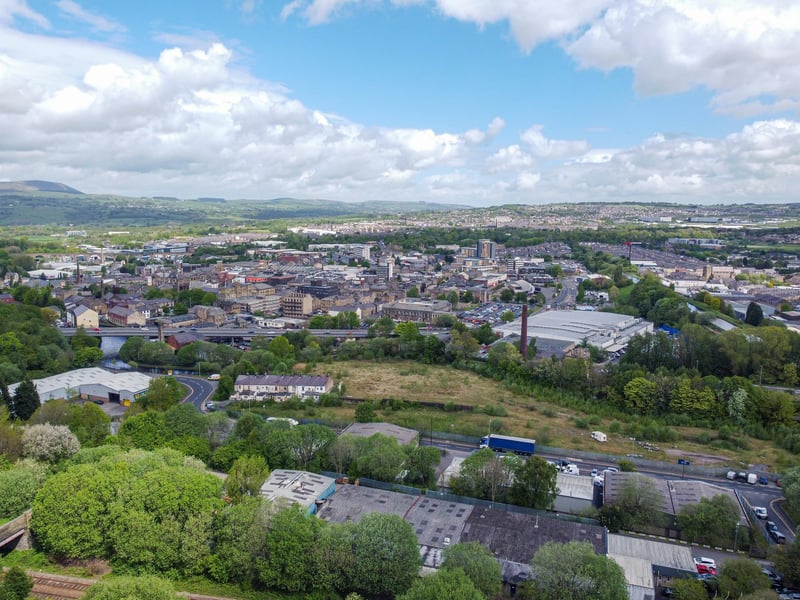
1. Burnley and Padiham house prices
How houses prices have changed across Burnley and Padiham over the past two decades Photo: Kelvin Stuttard
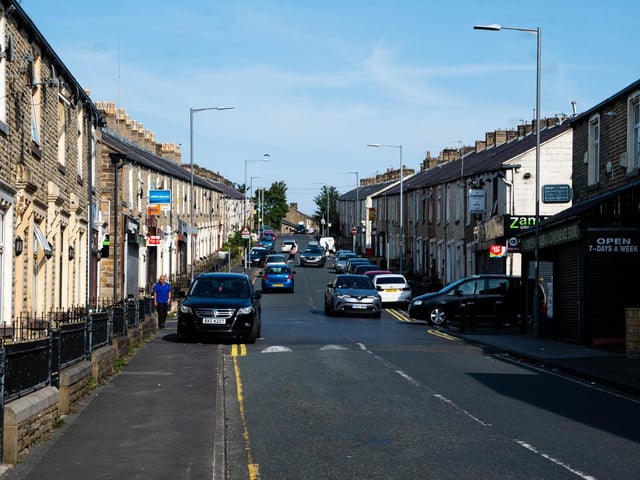
2. Central Burnley & Daneshouse.
Average property prices climbed from £24,000 in March 2005 to £70,000 by March 2025. Photo: Kelvin Stuttard
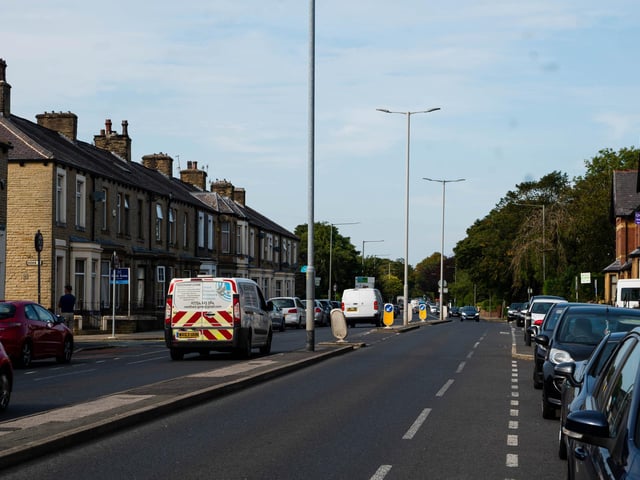
3. Queensgate
House prices jumped from £47,000 in March 2005 to £88,000 two decades later. Photo: Kelvin Stuttard
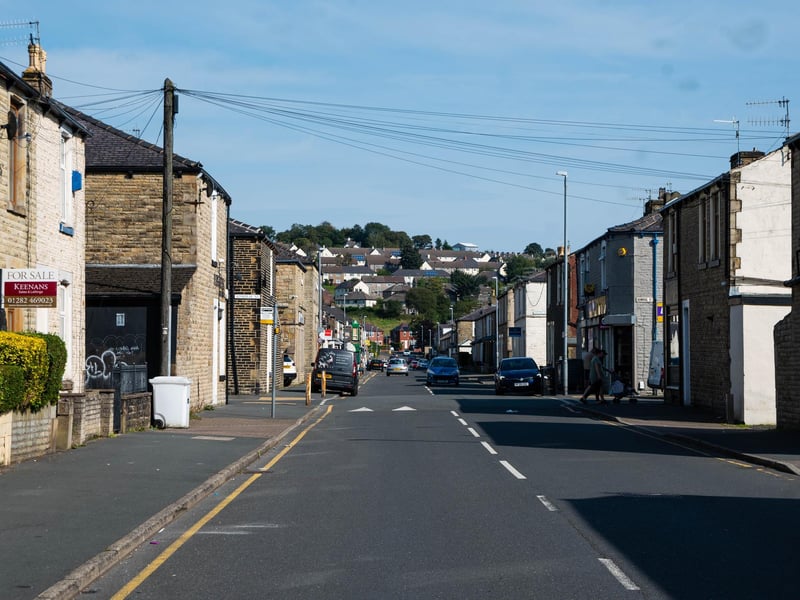
4. Bank Hall and Fulledge. Photo: Kelvin Stuttard
Property prices climbed from £35,000 in March 2005 to £82,500 by March 2025. Photo: Kelvin Stuttard