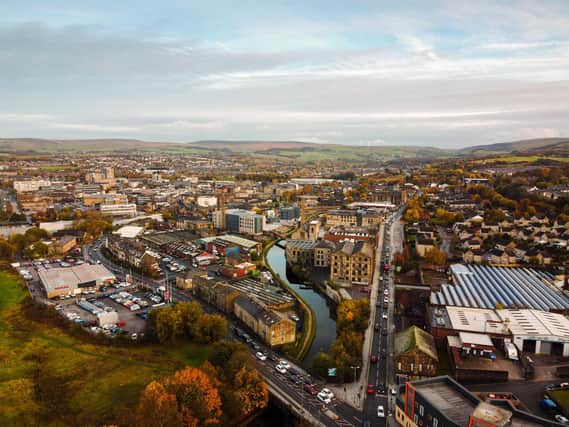
The latest government figures show 6 out of 12 neighbourhoods in Burnley still saw a rise in infections in the latest seven-day period, the second week in July.
Burnley recorded 437 cases in the seven days to 13 July, a rate of 491.5 per 100,000 people.
As restrictions on social distancing and mask wearing are now lifted in England, we reveal which Burnley neighbourhoods which saw the biggest rise in case rates per 100,000 people, and which saw cases fall.
Images used for for illustration purposes only.
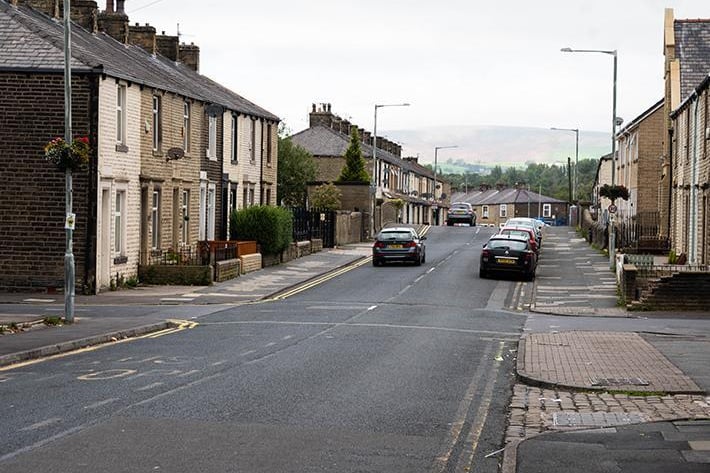
1. Whittlefield & Rose Grove
Whittlefield & Rose Grove has seen rates of positive Covid cases rise by 75%, from 442.3 to 774.
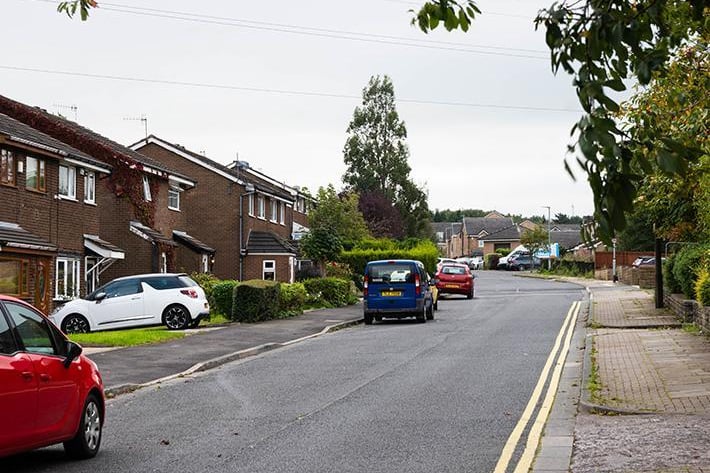
2. Hapton & Lowerhouse
Hapton & Lowerhouse has seen rates of positive Covid cases rise by 50%, from 373.9 to 560.8.
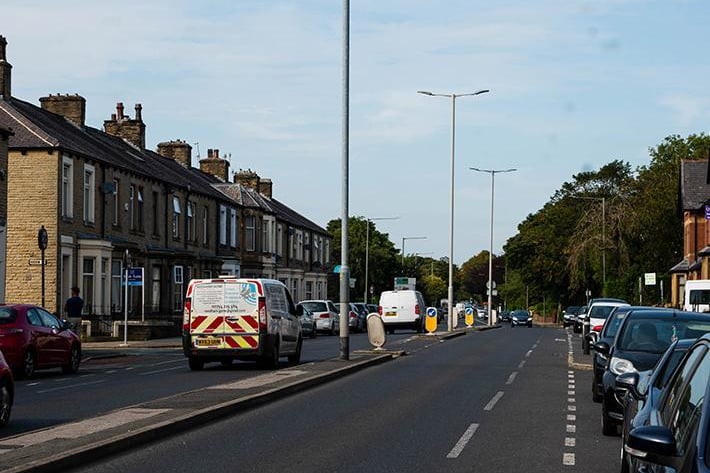
3. Queensgate
Queensgate has seen rates of positive Covid cases rise by 42%, from 201.9 to 286.
4. Harle Syke & Lanehead
Harle Syke & Lanehead has seen rates of positive Covid cases rise by 15%, from 536.4 to 616.3.
