Data update reveals thousands more Lancashire Covid cases - but recent improvements in rate of infection
and live on Freeview channel 276
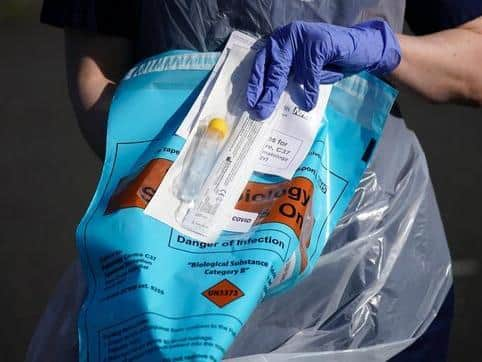
Public Health England (PHE) has now published the results of Covid tests carried out in the community – either via drive-through and mobile testing units or home swab kits – known as ‘pillar 2’ data.
Since the start of the pandemic, only ‘pillar 1’ test results – conducted on those with a clinical need and on health and care staff – have been made public.
Advertisement
Hide AdAdvertisement
Hide AdThe updated data reveals that an additional 3,617 people across the whole of Lancashire have tested positive, pushing the county total of known coronavirus cases since the outbreak began to 8,582.


Preston saw the biggest increase, with its confirmed case number jumping by 654, while Lancaster saw the smallest increase of just 68 extra cases.
However, the new figures also contain details of recent changes in the weekly case rate – the number of people testing positive for every 100,000 residents.
Across the county council area, that stat paints a positive picture, with the Lancashire County Council area rate having halved between the week ending 24th June and the week to 30th June – down from 15.0 to 7.4.
Advertisement
Hide AdAdvertisement
Hide AdThat puts Lancashire in the second to lowest bracket on the PHE ‘heat map’ of coronavirus case rates – whereas at the end of May it was amongst the worst affected areas in England.
Dr. Sakthi Karunanithi, the county council’s director of public health, said: “We knew all along that pillar 1 test results were just the tip of the iceberg.
“We have a dynamic intelligence framework that picks up signals from hospital admissions, deaths, test and trace as well as soft intelligence picked up from our services and members of the community.
“Whilst the number of positive tests reported have changed, it is reassuring to note that Lancashire’s weekly case rate is decreasing in the last few weeks.
Advertisement
Hide AdAdvertisement
Hide Ad“We are expecting more information on a district basis to be shared with us and will be publishing this every week.
“It is very important to reinforce messages on washing hands, watching 2 m distance and wearing a face covering along with staying at home and ordering a test if symptomatic.”
Across the whole of Lancashire, as of 2nd July, 1,253 people have died with Covid in the county’s hospitals and care homes.
TOTAL CONFIRMED COVID CASES IN LANCASHIRE AFTER ADDITION OF COMMUNITY TESTING RESULTS (as of 2nd July, 2020)
Advertisement
Hide AdAdvertisement
Hide AdThe figure in brackets shows the increase over the previously-reported figure, which was derived solely from NHS and PHE lab tests.
LANCASHIRE COUNTY COUNCIL AREA – 6,596 (+2,739)
BURNLEY – 437 (+236)
CHORLEY – 667 (+302)
FYLDE – 436 (+153)
HYNDBURN – 316 (+157)
LANCASTER – 879 (+68)
PENDLE – 416 (+214)
PRESTON – 1,144 (+654)
RIBBLE VALLEY – 187 (+82)
ROSSENDALE – 281 (+103)
SOUTH RIBBLE – 504 (+223)
WEST LANCASIRE – 709 (+315)
WYRE 620 (+232)
BLACKBURN WITH DARWEN – 974 (+550)
BLACKPOOL 1,012 (328)
Comment Guidelines
National World encourages reader discussion on our stories. User feedback, insights and back-and-forth exchanges add a rich layer of context to reporting. Please review our Community Guidelines before commenting.