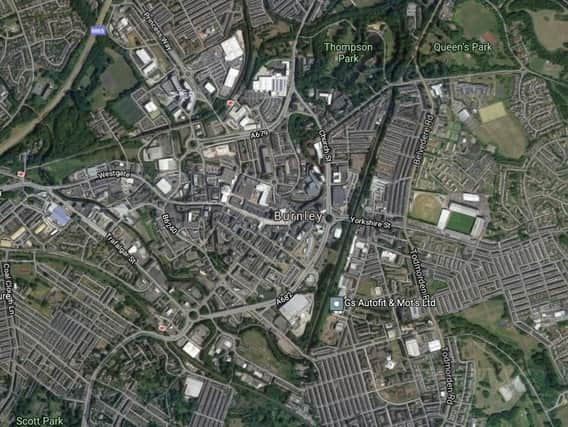
The latest figures show 11 neighbourhoods have seen a drop in infections, while only one have seen cases rise in the latest seven-day period.
Here we reveal which neighbourhoods have seen the biggest rise and fall in case rates per 100,000 people between January 28 to February 4.
1. Whittlefield & Rose Grove - down 50%
Whittlefield & Rose Grove has seen rates of positive Covid cases fall by 50%, from January 28 to February 4.
2. Cliviger, Worsthorne & Lane Bottom - down 50%
Cliviger, Worsthorne & Lane Bottom has seen rates of positive Covid cases fall by 50%, from January 28 to February 4.
3. Barclay Hills & Trinity - down 44%
Barclay Hills & Trinity has seen rates of positive Covid cases fall by 50%, from January 28 to February 4.
4. Harle Syke & Lanehead - down 42%
Harle Syke & Lanehead has seen rates of positive Covid cases fall by 42%, from January 28 to February 4.
